
The road to Idaho
Every salmon and steelhead bound for Idaho climbs eight fish ladders on the way. Four are on the Columbia in Oregon and Washington, then the route turns up the Snake for four more. None of them is in Idaho: Lower Granite, the last, sits in Washington about 50 km below the state line.
· yesterdayCurrent
The Corps posts each day's count a day late. Next update tomorrow around noon Mountain.
Fish counted at the four Columbia dams include fish bound for the upper Columbia, not only Idaho. Ice Harbor is the first count on the route that is purely Snake-bound, and Lower Granite is the last dam below Idaho.
The eight dams
In the order the fish meet them, ocean first. Bonneville and Lower Granite carry a passage chart, the two ends of the story.
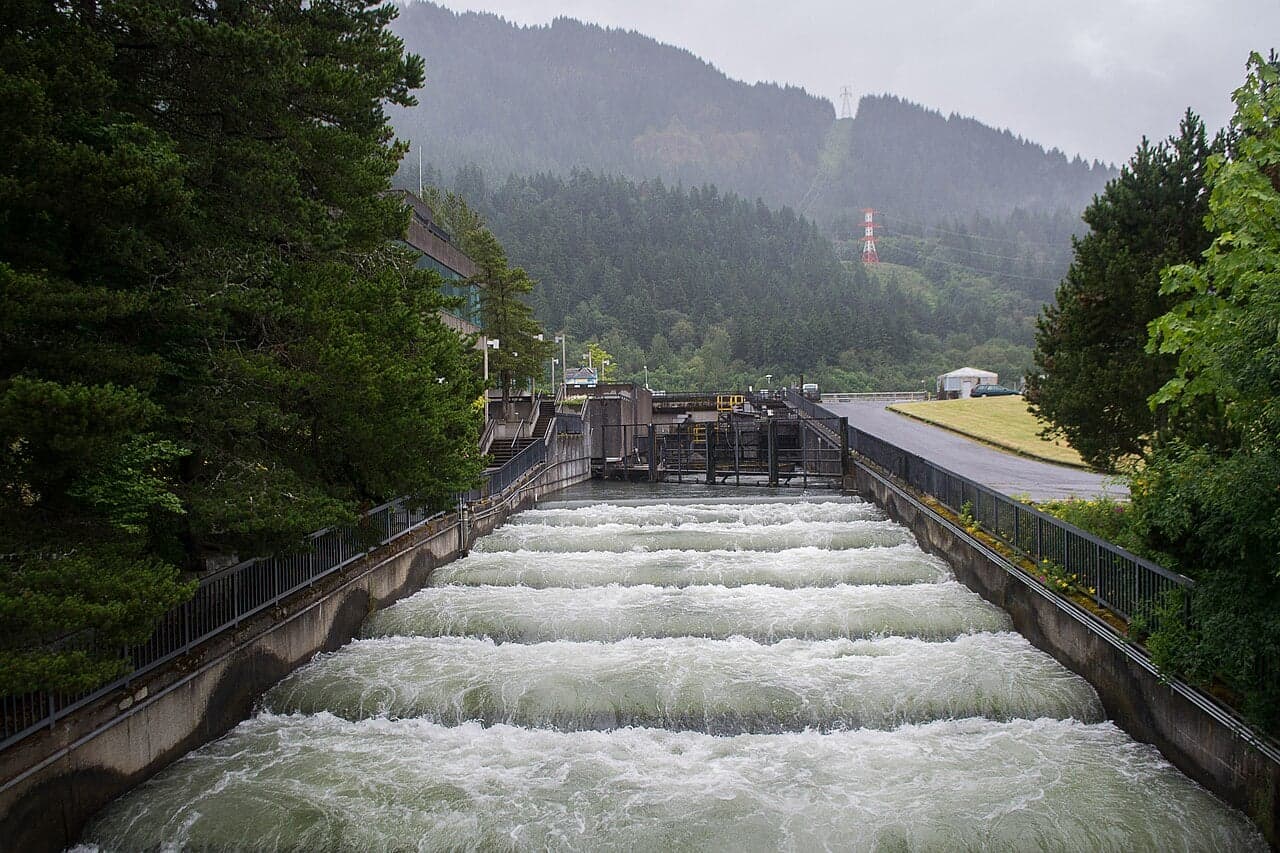
1Bonneville Dam
Photo: Wikimedia Commons 229 km from the Pacific
Counts here include fish bound for the upper Columbia, not only Idaho.
Steelhead
Nothing in this group is running today.
Out of season
- Steelhead · 58,983 countedSeason over
Salmon
Typical- Coho: the run is winding down, 92,238 so far
Out of season
- Spring chinook · 88,669 countedSeason over
- Summer chinook · 58,510 countedSeason over
- Fall chinook · 434,295 countedSeason over
- Sockeye · 74,034 countedSeason over
One fish = 5,000 counted this season
Passage over time Bars are the day's count at Bonneville Dam through Oct 22. The dashed line is what the date usually brings, the ten-year median.
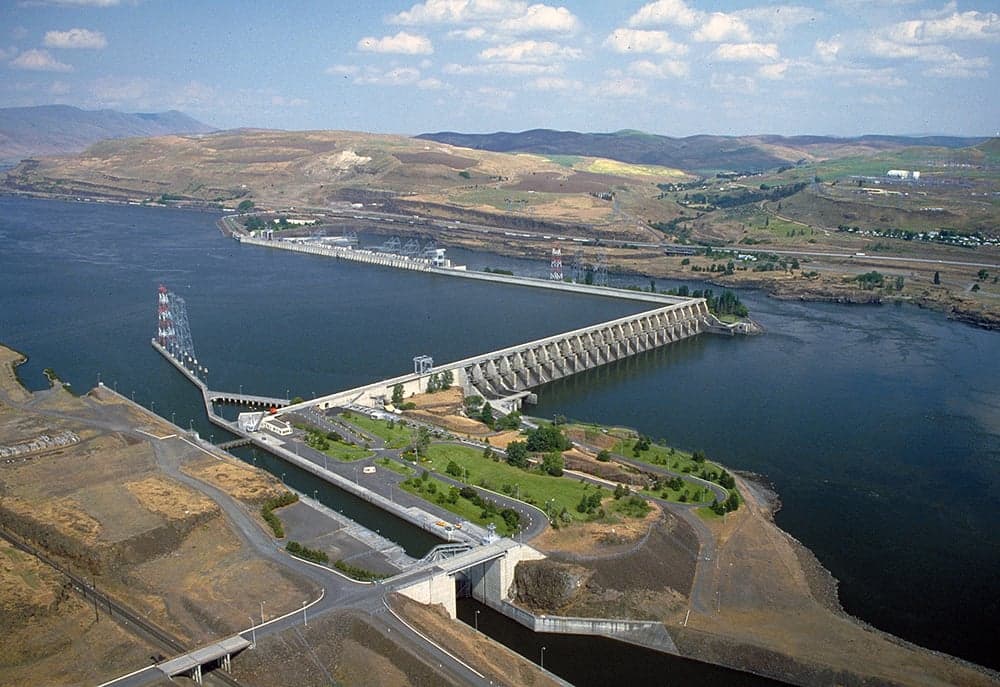
2The Dalles Dam
Photo: Columbia River System Operations EIS 302 km from the Pacific
Counts here include fish bound for the upper Columbia, not only Idaho.
Steelhead
Nothing in this group is running today.
Out of season
- Steelhead · 46,859 countedSeason over
Salmon
Nothing in this group is running today.
Out of season
- Spring chinook · 57,510 countedSeason over
- Summer chinook · 42,995 countedSeason over
- Fall chinook · 159,305 countedSeason over
- Sockeye · 68,223 countedSeason over
- Coho · 33,691 countedSeason over
One fish = 1,000 counted this season
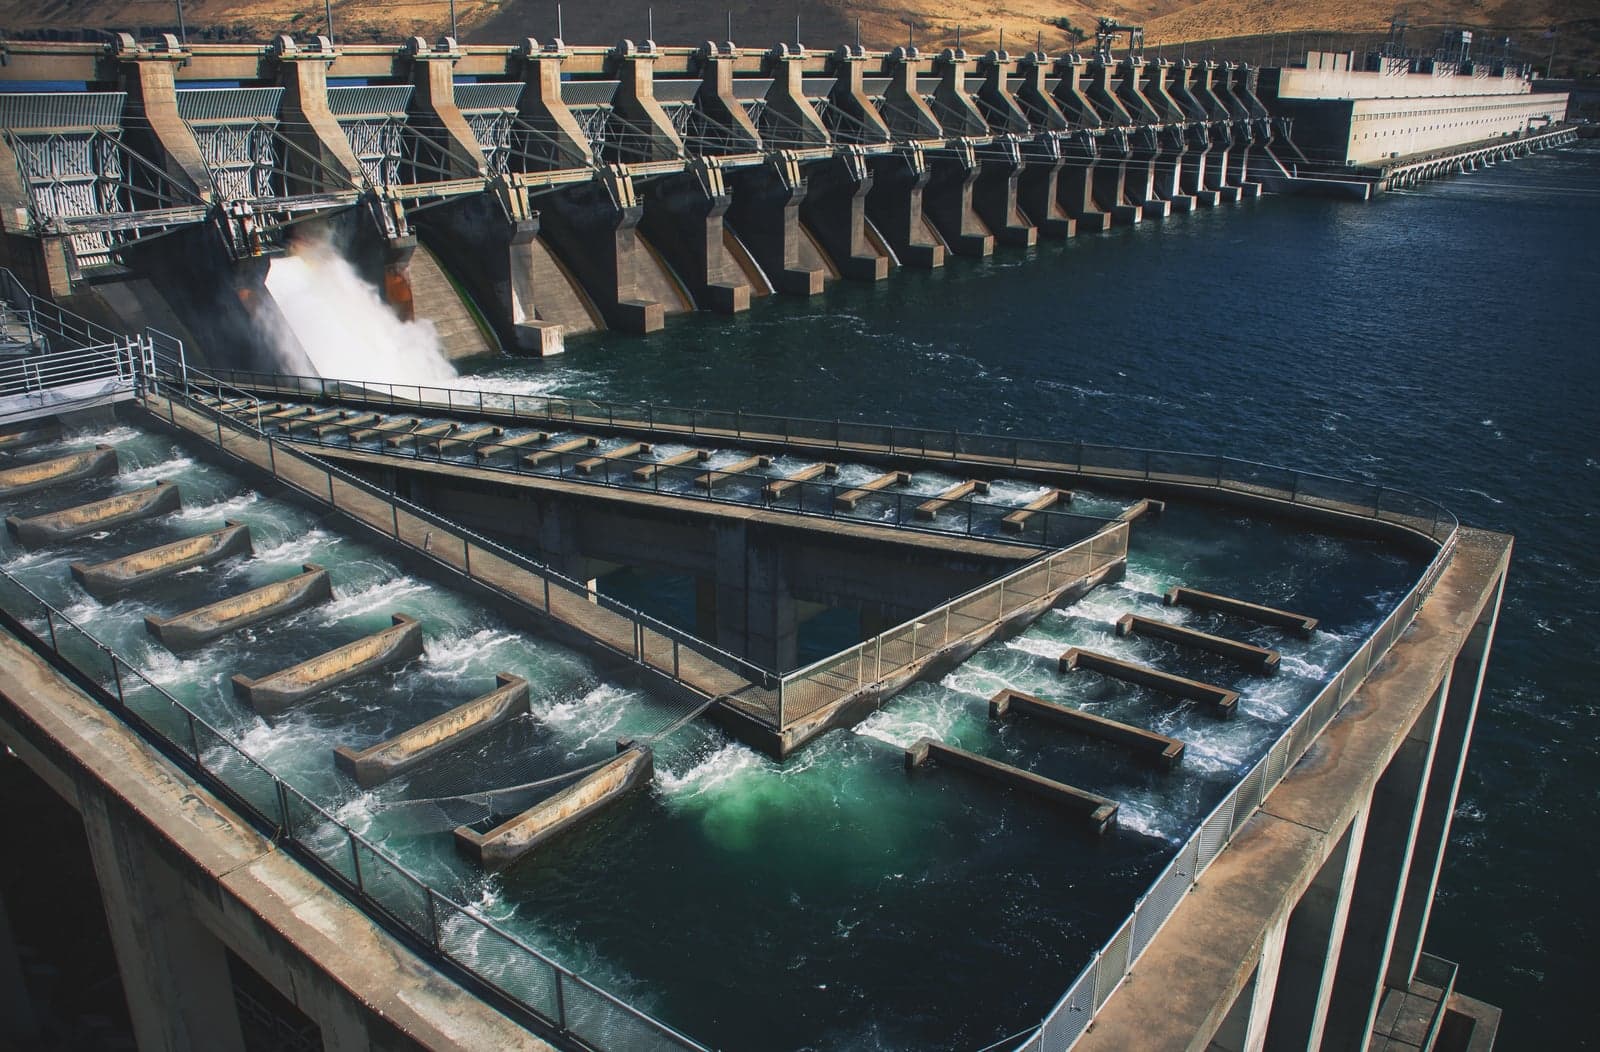
3John Day Dam
Photo: Portland District, U.S. Army Corps of Engineers 342 km from the Pacific
Counts here include fish bound for the upper Columbia, not only Idaho.
Steelhead
Nothing in this group is running today.
Out of season
- Steelhead · 37,454 countedSeason over
Salmon
Well below typical- Coho: the run is winding down, 25,311 so far
Out of season
- Spring chinook · 49,483 countedSeason over
- Summer chinook · 42,605 countedSeason over
- Fall chinook · 106,219 countedSeason over
- Sockeye · 61,655 countedSeason over
One fish = 5,000 counted this season
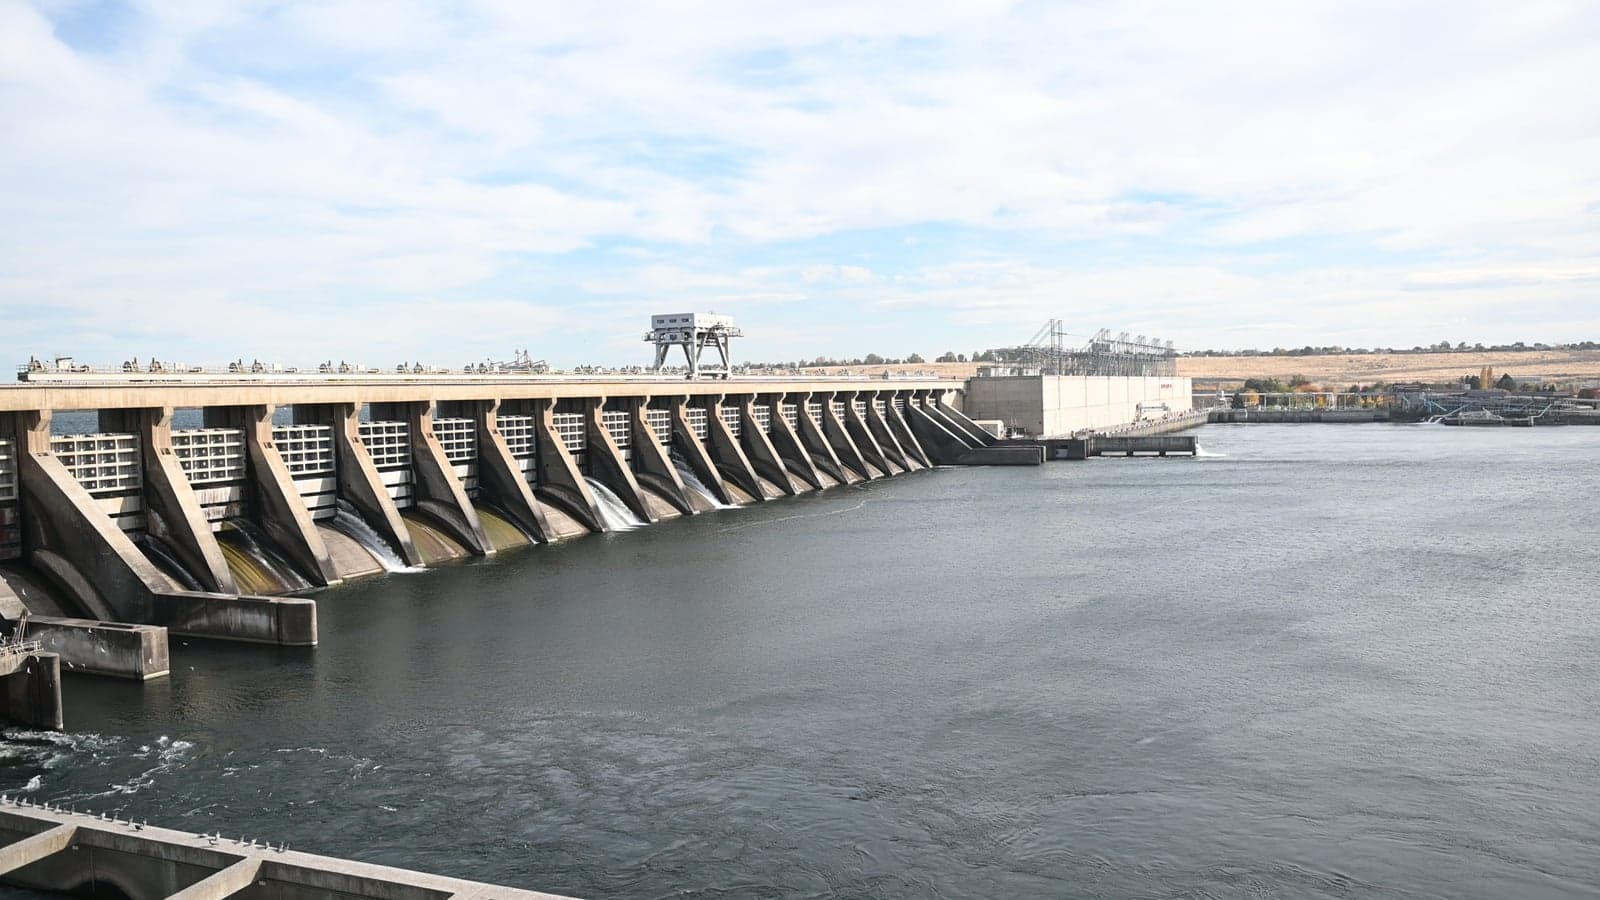
4McNary Dam
Photo: Portland District, U.S. Army Corps of Engineers 462 km from the Pacific
Counts here include fish bound for the upper Columbia, not only Idaho.
Steelhead
Nothing in this group is running today.
Out of season
- Steelhead · 35,874 countedSeason over
Salmon
Below typical- Coho: the run is winding down, 23,746 so far
Out of season
- Spring chinook · 43,275 countedSeason over
- Summer chinook · 39,933 countedSeason over
- Fall chinook · 98,369 countedSeason over
- Sockeye · 59,797 countedSeason over
One fish = 5,000 counted this season
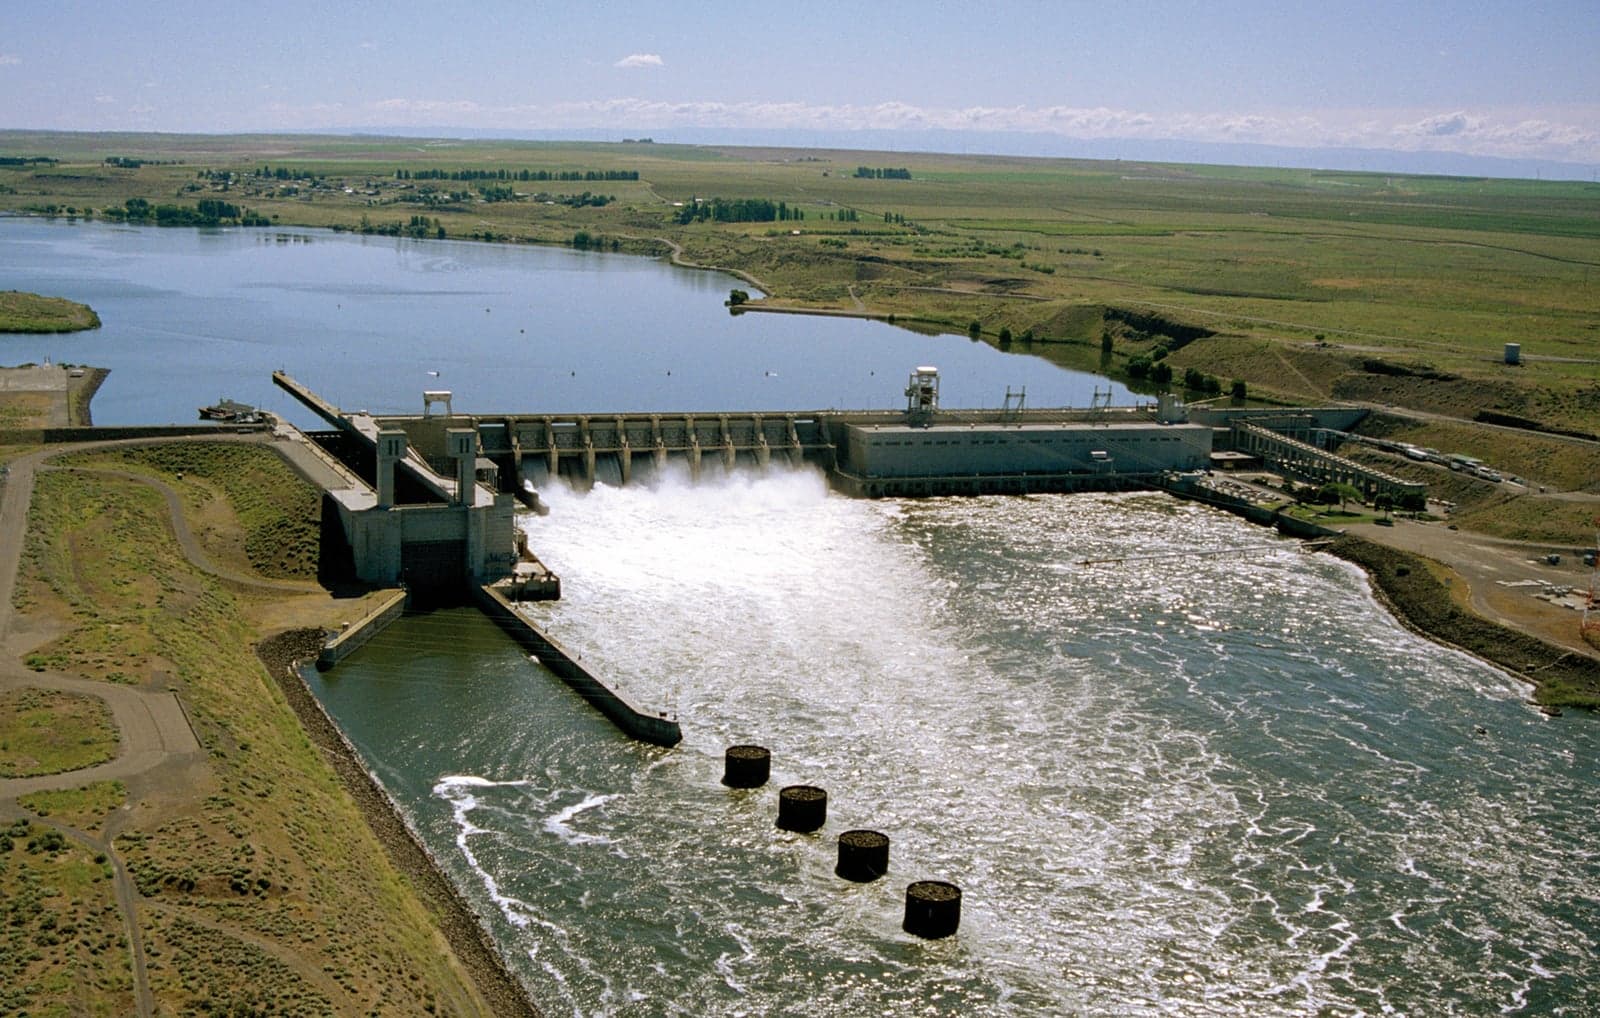
5Ice Harbor Dam
Photo: U.S. Army Corps of Engineers 528 km from the Pacific
Counts here are Snake-bound.
Steelhead
Well below typical- Steelhead: the run is winding down, 31,420 so far
Salmon
Below typical- Coho: the run is tapering off, 4,475 so far
Out of season
- Spring chinook · 30,542 countedSeason over
- Summer chinook · 8,569 countedSeason over
- Fall chinook · 29,050 countedSeason over
- Sockeye · 230 countedSeason over
One fish = 5,000 counted this season
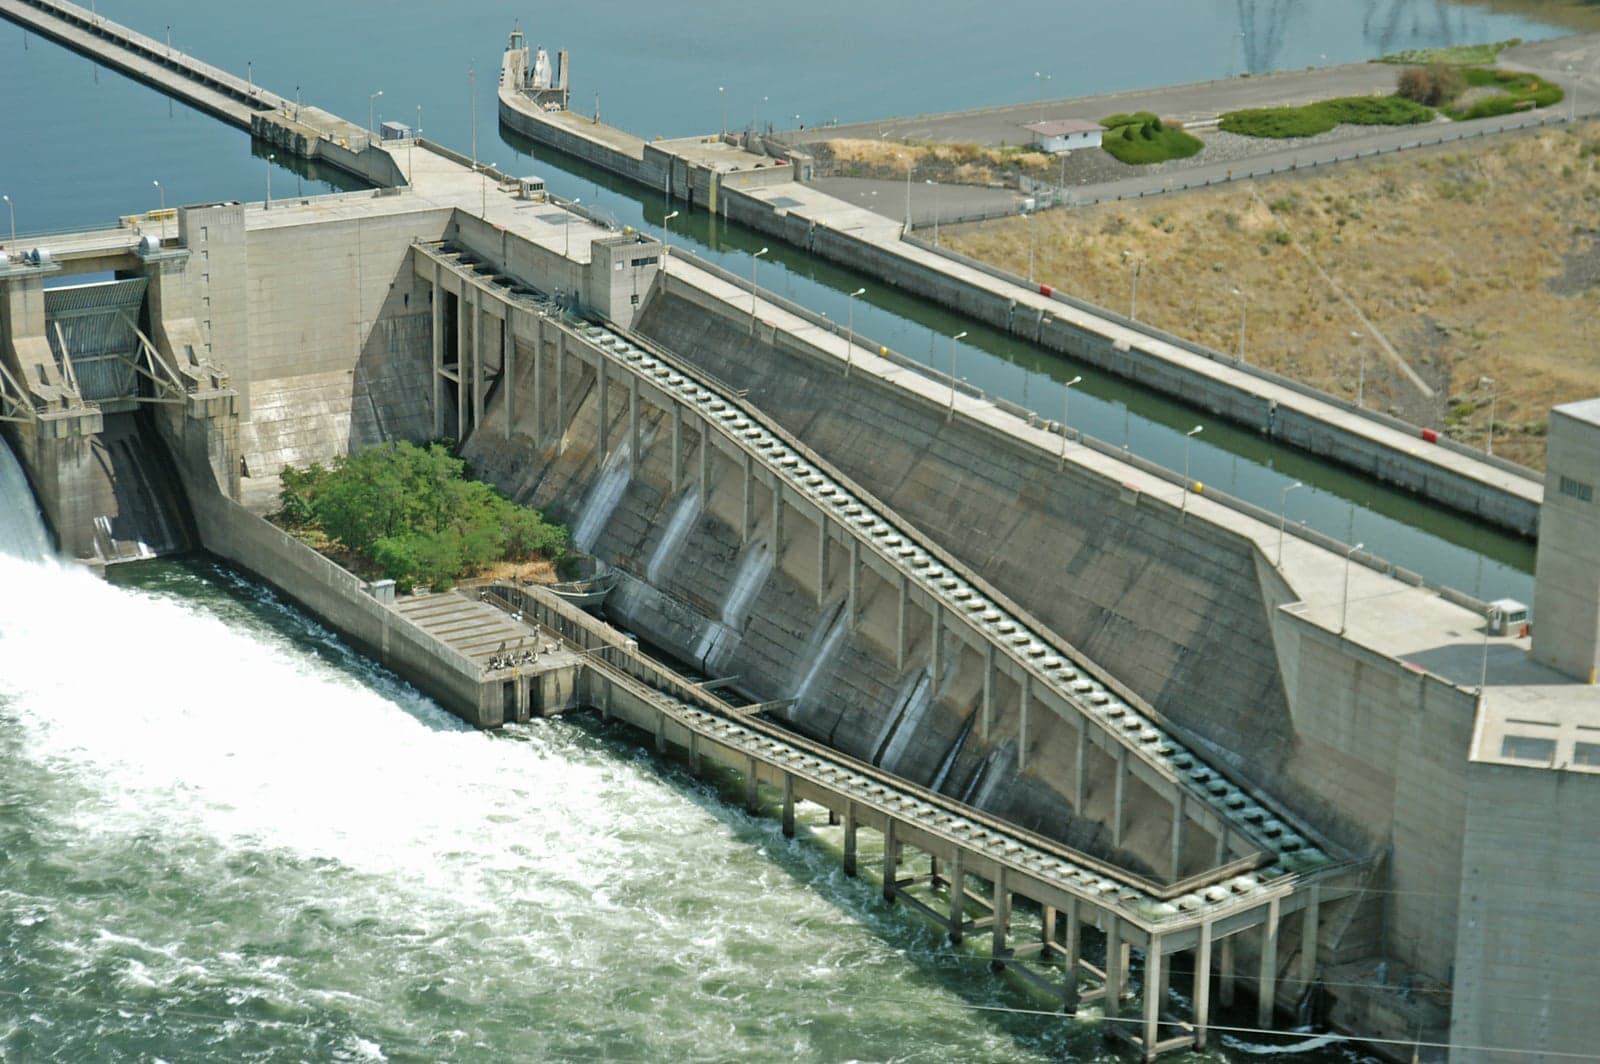
6Lower Monumental Dam
Photo: Wikimedia Commons 579 km from the Pacific
Counts here are Snake-bound.
Steelhead
Well below typical- Steelhead: the run is winding down, 29,029 so far
Salmon
Well below typical- Coho: the run is tapering off, 4,761 so far
Out of season
- Spring chinook · 28,604 countedSeason over
- Summer chinook · 9,553 countedSeason over
- Fall chinook · 26,754 countedSeason over
- Sockeye · 266 countedSeason over
One fish = 5,000 counted this season
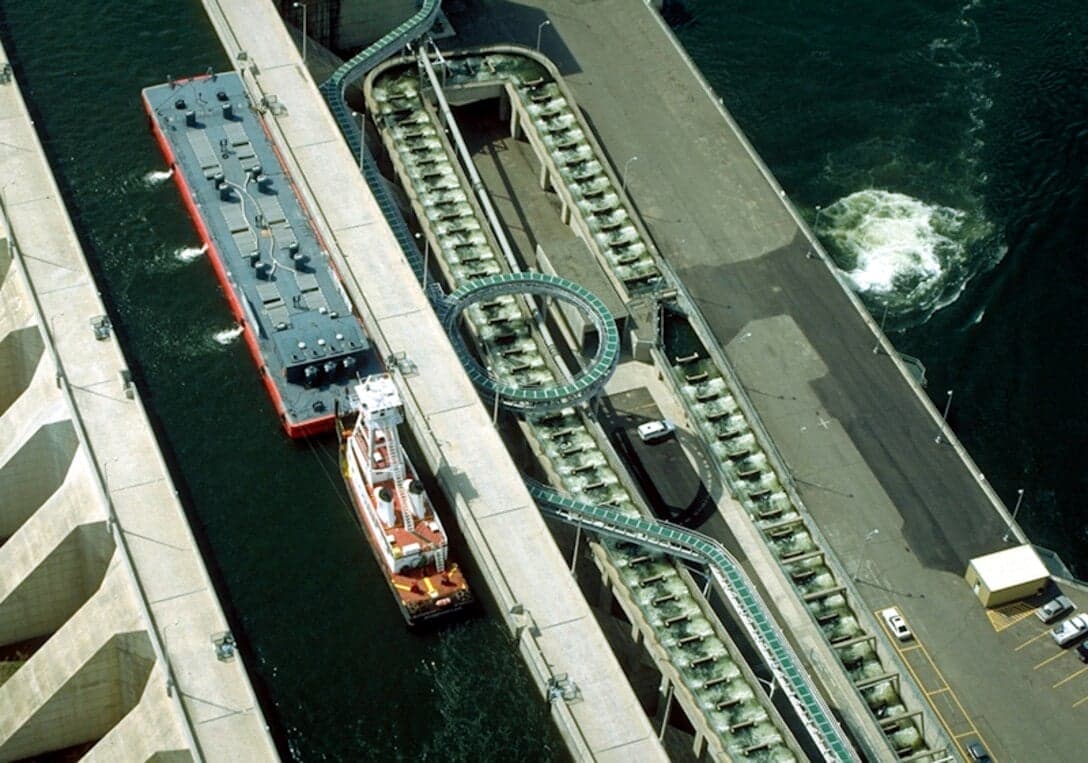
7Little Goose Dam
Photo: Northwestern Division, U.S. Army Corps of Engineers 625 km from the Pacific
Counts here are Snake-bound.
Steelhead
Well below typical- Steelhead: the run is winding down, 27,680 so far
Salmon
Well below typical- Coho: the run is tapering off, 4,932 so far
Out of season
- Spring chinook · 27,452 countedSeason over
- Summer chinook · 8,784 countedSeason over
- Fall chinook · 24,523 countedSeason over
- Sockeye · 241 countedSeason over
One fish = 5,000 counted this season
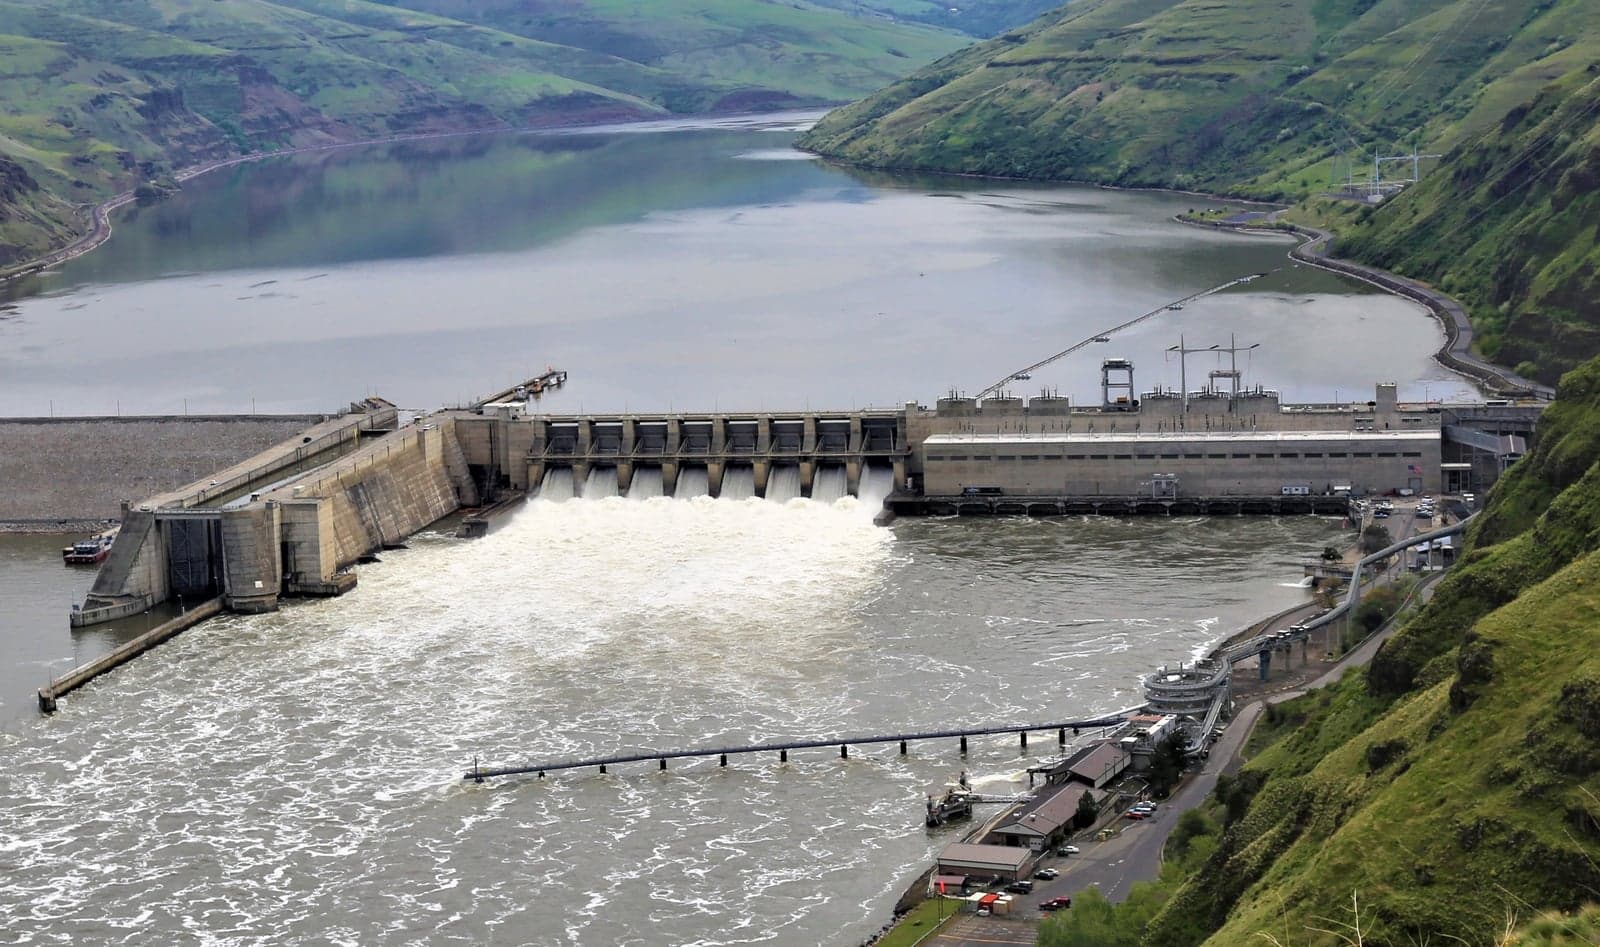
8Lower Granite Dam
Photo: Walla Walla District, U.S. Army Corps of Engineers 682 km from the Pacific
Counts here are Snake-bound.
Steelhead
Well below typical- Steelhead: the run is tapering off, 26,860 so far
Salmon
Well below typical- Coho: the run is tapering off, 3,671 so far
Out of season
- Spring chinook · 28,119 countedSeason over
- Summer chinook · 7,941 countedSeason over
- Fall chinook · 23,623 countedSeason over
- Sockeye · 221 countedSeason over
One fish = 5,000 counted this season
Passage over time Bars are the day's count at Lower Granite Dam through Oct 22. The dashed line is what the date usually brings, the ten-year median.
Passage over time Bars are the day's count at Lower Granite Dam through Oct 22. The dashed line is what the date usually brings, the ten-year median.
Waves on the way
No pulse is currently being followed between the dams.
How long it takes
Measured from the ladder counts themselves: the lag between run-year midpoints at each pair of dams, over run-years from 2010. Measured on September 11, 2026.
Steelhead
about 47 days
Slowest leg: Bonneville Dam to The Dalles Dam, 24 days
Spring Chinook
about 16 days
Slowest leg: Bonneville Dam to The Dalles Dam, 3 days
Summer Chinook
at least 12 days
Slowest leg: John Day Dam to McNary Dam, 3 days
Fall Chinook
at least 14 days
Slowest leg: Bonneville Dam to The Dalles Dam, 4 days
Sockeye
about 17 days
Slowest leg: McNary Dam to Ice Harbor Dam, 7 days
Each gap is a dam, Bonneville first and Lower Granite last. Point at a leg, or tab to it, to see the dam it ends at and how long it takes.
Leg by leg, with the usual range
Steelheadabout 47 days, ocean to Idaho
| Between | Days (10th / median / 90th) |
|---|---|
| Bonneville Dam to The Dalles Dam | 15 / 24 / 31 |
| The Dalles Dam to John Day Dam | 5 / 7 / 11 |
| John Day Dam to McNary Dam | 3 / 3 / 5 |
| McNary Dam to Ice Harbor Dam | 3 / 5 / 7 |
| Ice Harbor Dam to Lower Monumental Dam | 1 / 2 / 3 |
| Lower Monumental Dam to Little Goose Dam | 1 / 2 / 4 |
| Little Goose Dam to Lower Granite Dam | 3 / 4 / 5 |
Spring Chinookabout 16 days, ocean to Idaho
| Between | Days (10th / median / 90th) |
|---|---|
| Bonneville Dam to The Dalles Dam | 2 / 3 / 4 |
| The Dalles Dam to John Day Dam | 1 / 2 / 2 |
| John Day Dam to McNary Dam | 2 / 3 / 4 |
| McNary Dam to Ice Harbor Dam | 0 / 1 / 3 |
| Ice Harbor Dam to Lower Monumental Dam | 1 / 2 / 3 |
| Lower Monumental Dam to Little Goose Dam | 2 / 3 / 6 |
| Little Goose Dam to Lower Granite Dam | 1 / 2 / 3 |
Summer Chinook
| Between | Days (10th / median / 90th) |
|---|---|
| Bonneville Dam to The Dalles Dam | 1 / 2 / 4 |
| The Dalles Dam to John Day Dam | 1 / 1 / 2 |
| John Day Dam to McNary Dam | 2 / 3 / 3 |
| McNary Dam to Ice Harbor Dam | not measurable, see below |
| Ice Harbor Dam to Lower Monumental Dam | 0 / 1 / 2 |
| Lower Monumental Dam to Little Goose Dam | 1 / 3 / 5 |
| Little Goose Dam to Lower Granite Dam | 1 / 2 / 3 |
Fall Chinook
| Between | Days (10th / median / 90th) |
|---|---|
| Bonneville Dam to The Dalles Dam | 3 / 4 / 5 |
| The Dalles Dam to John Day Dam | 2 / 2 / 4 |
| John Day Dam to McNary Dam | 2 / 3 / 4 |
| McNary Dam to Ice Harbor Dam | not measurable, see below |
| Ice Harbor Dam to Lower Monumental Dam | 0 / 1 / 2 |
| Lower Monumental Dam to Little Goose Dam | 1 / 2 / 3 |
| Little Goose Dam to Lower Granite Dam | 1 / 2 / 3 |
Sockeyeabout 17 days, ocean to Idaho
| Between | Days (10th / median / 90th) |
|---|---|
| Bonneville Dam to The Dalles Dam | 1 / 2 / 2 |
| The Dalles Dam to John Day Dam | 1 / 1 / 2 |
| John Day Dam to McNary Dam | 2 / 2 / 2 |
| McNary Dam to Ice Harbor Dam | 5 / 7 / 14 |
| Ice Harbor Dam to Lower Monumental Dam | 0 / 2 / 3 |
| Lower Monumental Dam to Little Goose Dam | 1 / 1 / 3 |
| Little Goose Dam to Lower Granite Dam | 1 / 2 / 3 |
Where a pair is marked not measurable, the two dams are counting different populations rather than the same fish later. McNary's midpoint belongs to the upper Columbia run, so for summer and fall chinook the lag from McNary to Ice Harbor comes out negative. It is an artefact of the comparison, not a fish swimming backwards, and the wave detector refuses those pairs for the same reason.
What a count means
Counts by the U.S. Army Corps of Engineers via Columbia River DART. A count is adult fish through a ladder on a day. It is not an estimate of a run, it does not say where an individual fish is going, and it says nothing about fishing.
Counts usually run a day behind, which is why every number here carries the date it describes rather than today's.